Deer Run Heights Landslide
|
|
|
|
back to Kanat's home page
Students in the Environmental Science Program at JSC have initiated research projects on the Deer Run Heights Landslide in Jeffersonville, VT. This work is being conducted in association with the Vermont Geological Survey and George Springston of Norwich University. Some of the activities include:
Measuring the rate of erosion along the slip face.
Measuring the changing angles and distance between trees on an active part of the slide.
Measuring pore water pressure in four monitoring wells.
Measuring slip along layers using time domain reflectometry in four monitoring wells.
Monitoring local precipitation and discharge along the Brewster River.
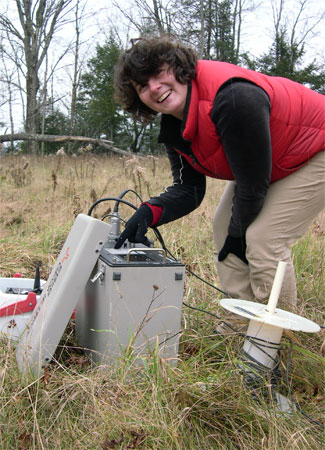
Conduct seismic profiling along the southern part of the ridge.
Adam Banks, 2009: Unstable lake sediments of Deer Run Heights represent a potential landslide hazard to the Cambridge Elementary School in Jeffersonville, Vermont.
Jay Cairelli, 2008: Downslope movement of trees and unconsolidated sediment at the Deer Run Heights in Jeffersonville, Vermont.
Michaela Forsberg, 2007: Glacio-lacustrine Deposits Create Landslide Hazards at Deer Run Heights in Jeffersonville, Vermont.
Christine Languerand, 2012: Seismic Refraction: A Geologic Exploration of the Jeffersonville Landslide.
Matthew Patenaude, 2015: Data Collection and Data Transfer Using a Total Mapping Station.
Nate Weiss, 2012: Analysis of Hydrologic Factors at the Deer Run Heights landslide in Jeffersonville, VT.
Amanda Wells, 2011: Correlating Precipitation to Changes in Groundwater and Stream Depth to Evaluate Slope Instability at Deer Run Heights in Jeffersonville, Vermont, 2011.
November 2009: Seismic profiling of the Brewster Uplands Community Trust Field
April 2009: Topographic mapping and installation of stream gages
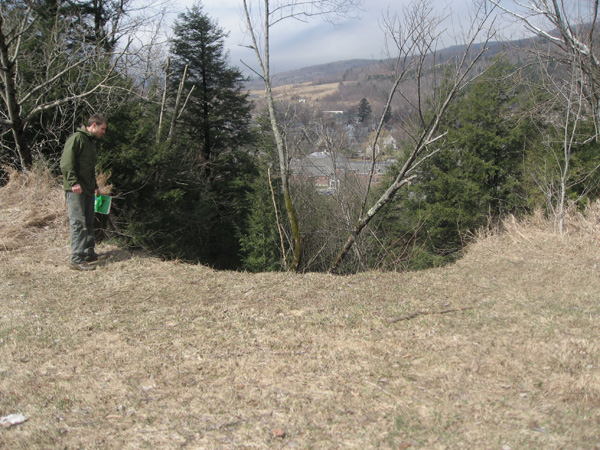
April 2008: Spring melt and small slide above the Cambridge Elementary School
May 2007: Installation of four monitoring and time domain reflectometry wells above the Farara Slide
Water Measurement Manual, US Bureau of Reclamation, 2001
USGS Landslide Handbook at http://pubs.usgs.gov/circ/1325/

|
|||
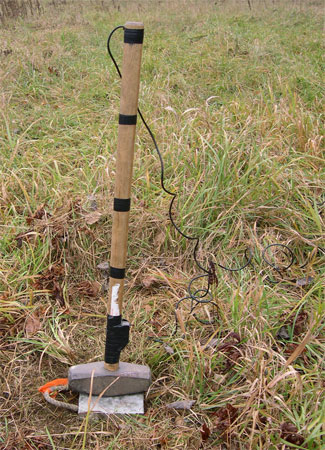
Energy source is a sledge hammer with an impact activated switch. |
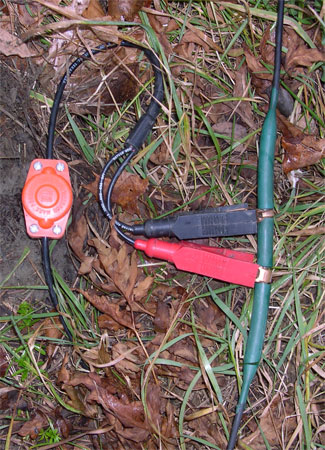
Geophones are regularly spaced and connected via coaxial cable. |
||
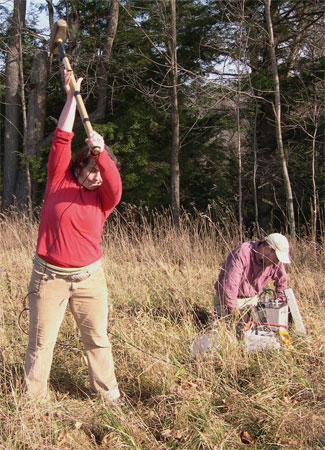
Setting up for the swing... |
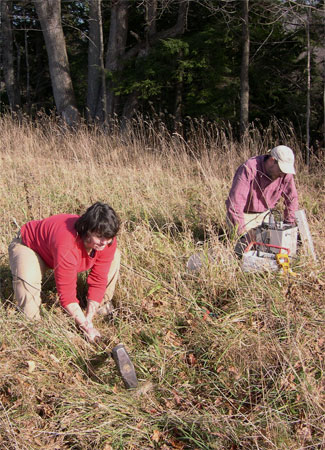
...and impact on an aluminum plate. |
||
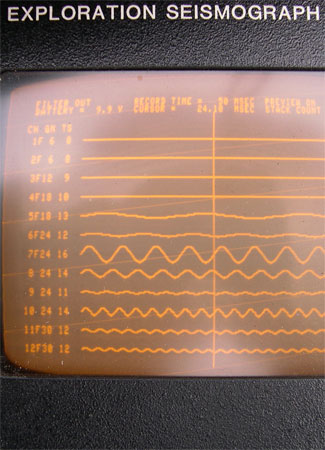
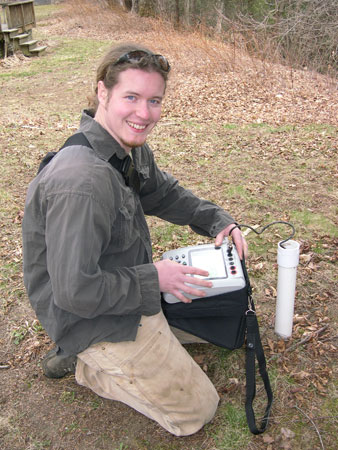
Reading the results (note battery in cooler). |
Geophones 1 through 4 were disconnected. |
||
|
||||
|
Brewster Uplands Community Trust Field |
||||
|
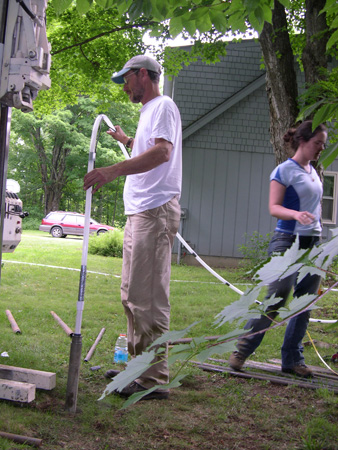
Installation of time domain reflectometry wells (July 2009). |
|||
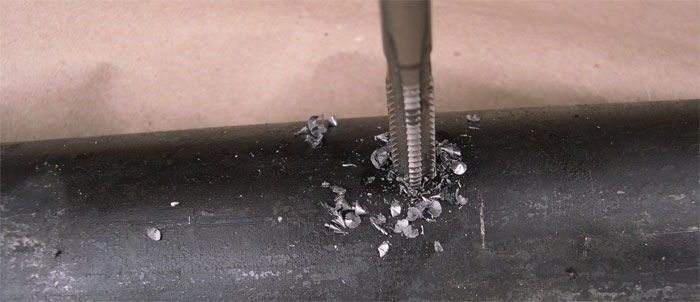
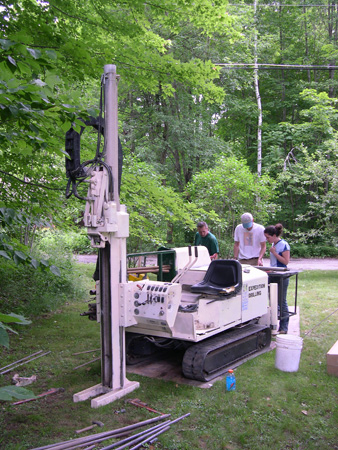
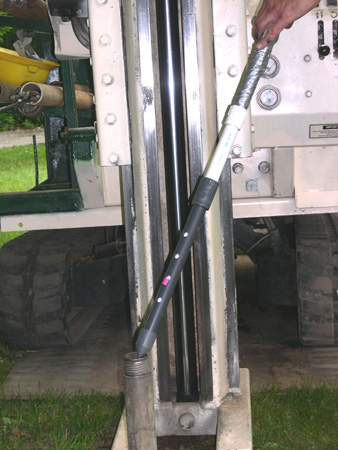
Geoprobe
hammering of 2-3/8" ID casing to 91'. |
Casing
is flushed as hammering continues. |
||
Flushing fluids recirculated in settling tank. |
Clean water flush when drilling complete. |
||
Flushing
of well. |
Hand-bailing
of well. |
||
RG6/U Coleman
coaxial cable, and weight, |
Portland
cement pumped into casing |
||
Cement pumping system. |
Casing removed and slid off cable. |
||
|
Coaxial cable installed in wells to be used for time domain reflectometry using a Megger CFL535F cable fault locator. Installation and drilling by Specialty Drilling & Investigation. |
|||
|
Continuous split-spoon sampling and installation of monitoring wells. |
|||
Auger
drilling. |
Hammering
a two-foot split spoon. |
||
Split-spoon tube. |
Shelby tube sampling at 69-71 feet. |
||
Winter
layer in silty fine sand at 42-44 feet. |
Jon,
Marjie, Les, and George on site. |
||
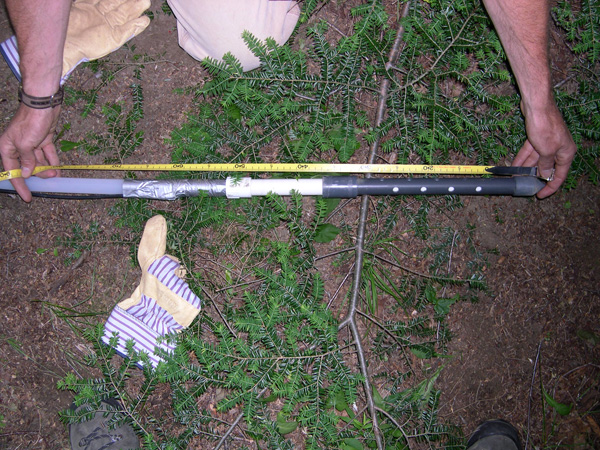
Five-foot
slotted screen piezometer. |
Six feet of sand poured around slotted screen and capped with two feet of clay. |
||
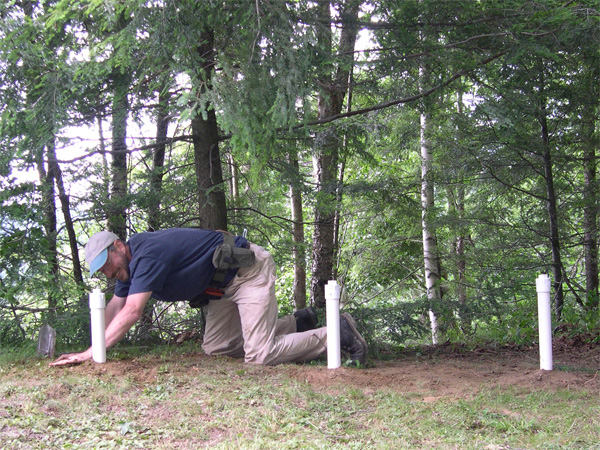
Monitoring well capped. |
Well head in place. |
||
|
Four monitoring wells were installed; three wells were drilled using split-spoon sampling. Installation and drilling by Specialty Drilling & Investigation. |
|||
|
|
||
|
|||
|
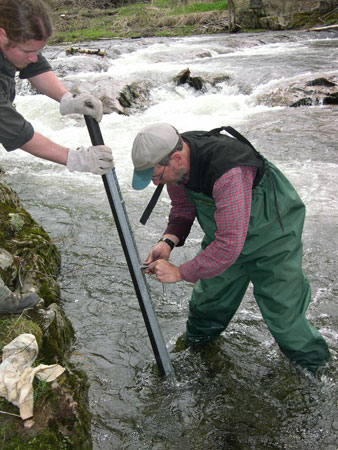
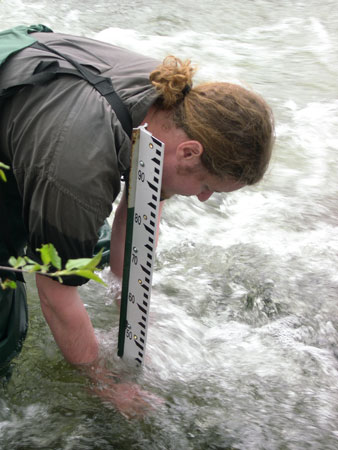
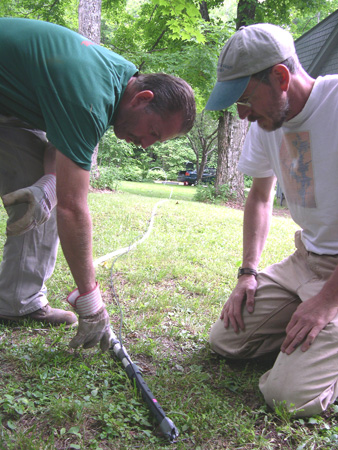
George
and Ed install two stream gages; one uses pressure sensors
(HOBO
data loggers)
within a threaded steel rod, the other gage measures stream
stage in meters. |
|||
|
||||
|
Ed
Robbins uses time domain reflectometry in order to identify |
||||
|
||||
|
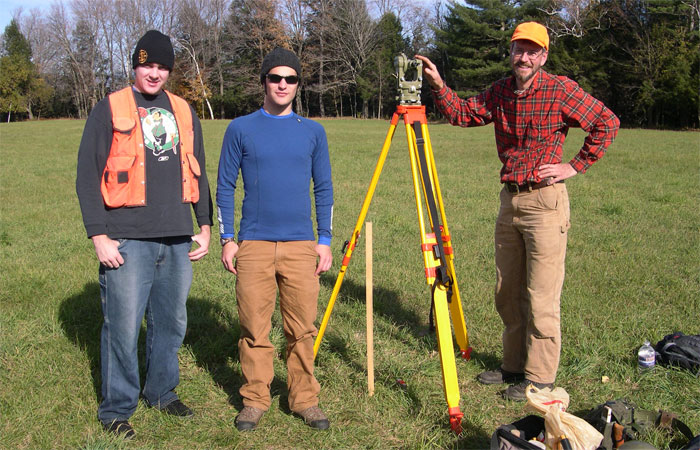
Chris
Brookfield, Sam Hellman, and George Springston |
||||
|
||||
|
Approximately
100 m3 sediment moved downslope; note school in
background. |
||||
|
||||
|
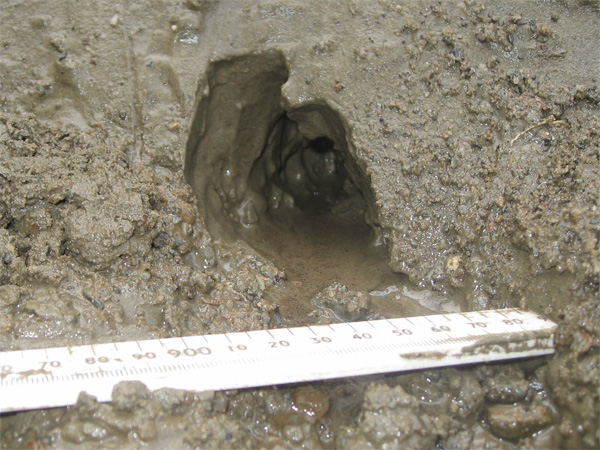
Base of
slide seems to be assisted my the removal of sediment above
a significant silt |
||||
|
|
Water permeates the top four meters of sands and conglomerates, then reaches a silty-clay horizon. The water-rich fine-grained sediment (including the silty-clay) flows downhill allowing semi-consolidated slumping of the sediments above. Click here to see a short video. 12 April 2008 |
|
||||
|
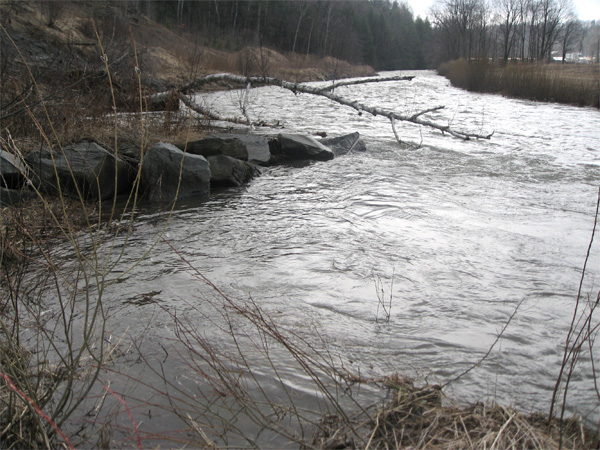
Rip-rap
at the base of the Farara slide appears to be directing
water |
||||
|
||||
|
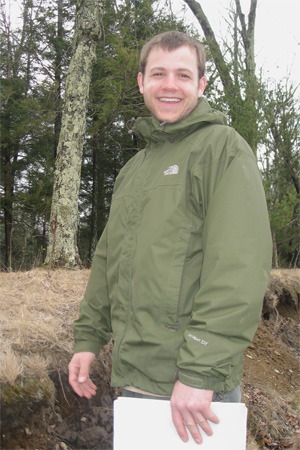
Jay
Cairelli |
||||
|
||||
|
The
Geoprobe provided by |
||||
|
||||
|
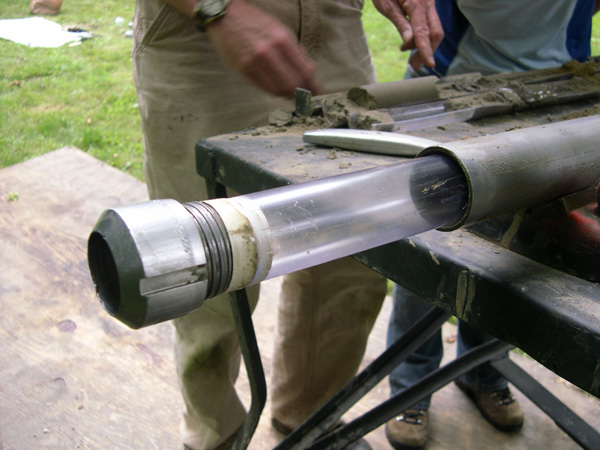
Drill tip and collection tube used for continuous coring. |
||||
|
||||
|
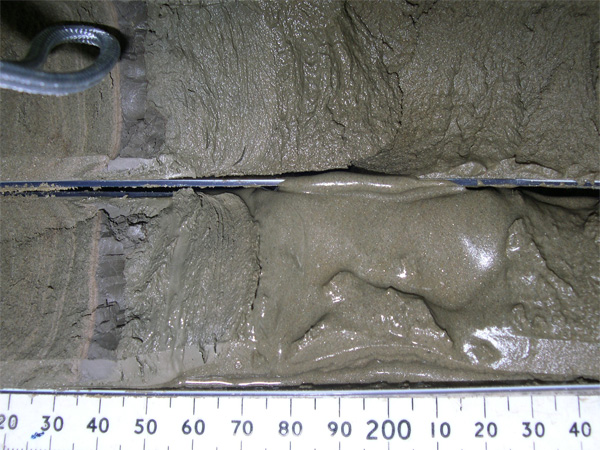
Core section exhibiting saturated and unsaturated sections (cm scale). |
||||
|
||||
|
Micky and George catalogue core samples. |
||||
|
||||
|
|
||||
|
||||
|
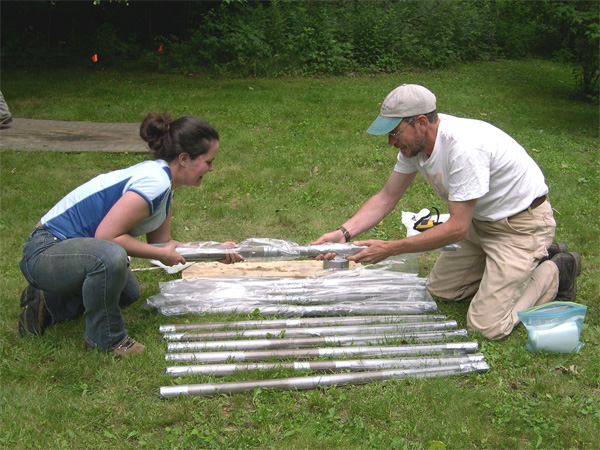
piezometer and coaxial cable assembly. |
||||
|
||||
|
Placing the piezometer inside the drill tubes. |
||||
|
||||
|
Piezometer
and coaxial cable assembly |
||||
|
||||
|
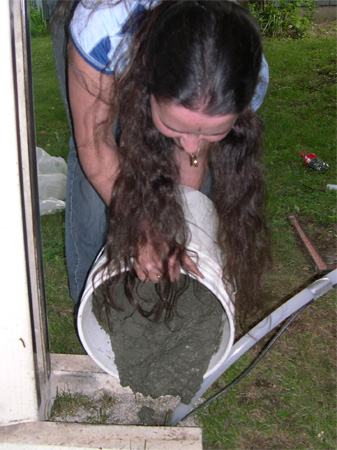
Micky
Forsberg pours a casement of concrete sand mix |
||||
|
||||
|
Finishing off the caps on three monitoring wells. |
||||
Back to Kanat's home page or send e-mail to Leslie Kanat