|
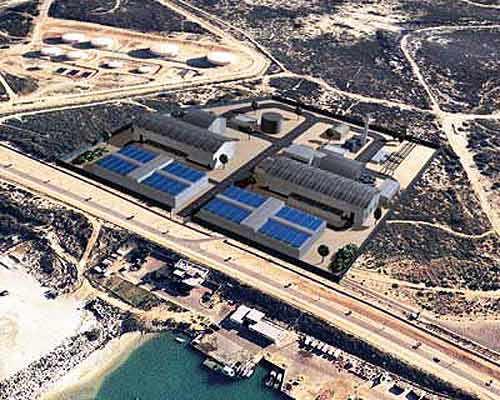
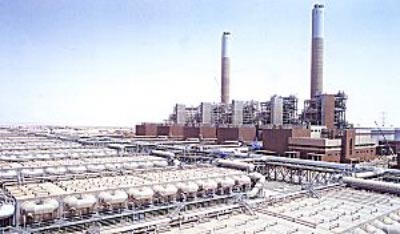
Figure 2. Artists Interpretation of a Desalination Plant (Water Industry, 2004) |
| Population: Population is one of the major factors influencing the need for desalination plants worldwide. The worlds population is growing exponentially, therefore exponentially increasing the demand for water. As seen in Figure 3 the worlds population is expected to reach nine billion by the year 2050. This is an additional 3 billion people to the current population, or a fifty percent increase in only 46 years (U.S. Census Bureau, 2003). |
Figure 3. World Population Graph (After U.S. Census Bureau, 2003)
|
United States Population
Figure 4. U.S. Population (U.S. Census Bureau, 2004) |
| Water Resources: Water resources are currently stressed in many areas of the world as can be seen in figure 5. Areas experiencing water stress are all areas where per-capita water supply drops below 1700m3/year. An area which falls into this category frequently experiences disruptive water shortages. In areas where the per-capita water supply drops below 100m3/year problems with food production and economic growth are often experienced. In 1995 41 percent of the worlds population or 2.3 billion people live in areas experiencing water stress. Of this 2.3 billion people 1.7 billion of them live in highly stressed areas where per-capita water supply is below 100m3/year. It is projected that by the year 2025 if nothing changes 3.5 billion people, 48 percent of the projected population will live in water stressed areas. Two point four billion will be in high stress areas. As the population increases the per-capita water supply decreases. Of the river basins whose population is expected to rise above ten million, 6 of them will drop below the water stress level. These basins include: the Volta, Farah, Nile, Tigris and Euphrates, Narmada, and the Colorado River Basin. In addition 29 additional river basins will also become more scarce (WRI, 2004). |
|
World Annual Renewable Water Supply Per Capita
Figure 5. Renewable Water Per Capita (WRI, 2004) |

Figure 6. Drought in The United States (Holz, 2003) |
Not only is the lack of water a problem but the lack of potable water is also an enormous issue. There are over 1 billion people in the world today or approximately 15 percent of the worlds population without access to safe drinking water. As can be seen in Figure 8 all areas of the world are experiencing problems with unsafe drinking water. In Africa only 46 percent of the population has access to safe drinking water and 381 million people do not. Ninety-seven million people in Latin America and the Caribbean are without safe drinking water. Asia and the Pacific have 627 million people without safe drinking water. There are ten million people in Western Asia without safe drinking water for a total of 1.115 billion people in the world without access to safe drinking water. The lack of unsafe drinking water can bring forth serious consequences, such as disease, sickness, and death. Figure 9 shows the estimated global morbidity and mortality of water related diseases. These estimates were for the 1990's so this number will actually be greater now due to increased population (WRI, 2004). Wars over water recources could also be conceivable in the near future. Some problems already exist along the Tigris and Euphrates rivers. As shown in figure 7 the United States Department of the Interior has listed 35 areas in the United States that could experience "water wars" as soon as 2025 ( (Olympian, 2003). |
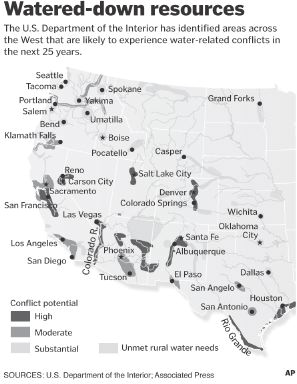
Figure 7. Areas Expected to Experience Water Conflict by 2025 (Olympian, 2003).
|
![]()
|
Figure 8. Access to Safe Drinking Water (After World Resources Institute, 2004) |
Figure 9. Estimates of Water Related Diseases. (After World Health Organization, 1995) |
| Desalination Plants: Desalination can be the answer to the worlds water resource problems. A desalination plant is a plant which removes salt, and other substances from a water source. These plants can draw either from the ocean or underground saline aquifers as seen in Figure 10. All desalination plants involve three liquid streams; the saline/brackish feedwater, the low salinity product water, and the brine (byproduct-high salinity). The feedwater is supplied from oceanic or underground sources, and is separated by the desalination process into the product water and brine water streams. The product water from desalination plants has less than 500mg/1 dissolved solids. This is suitable for domestic, agricultural, and industrial applications. The brine is very concentrated with a more than 35,000 mg/1 dissolved solids. This brine can be discharged into deep saline aquifers, diluted with effluent, or discharged into surface waters (OAS 1, 2003). Desalination plants can be used to tap into the vast oceans, and use them as a viable water source, suitable for human consumption. Over seventy-five percent of the world is covered by water, but water is not an endless resource. 97.2 percent of the water in the world is salt water, unfit for human consumption. 2.38 percent is frozen in icecaps, or glaciers and is also unavailable. 0.397 percent is in ground water, 0.022 percent in surface water, and 0.001 percent in the atmosphere (EPA, 2003). By introducing desalination plants we can gain access to 231 times as much water as is presently available. there are different methods of desalination. There are Reverse Osmosis, Distillation, and Electrolysis. The most widely used in the world today is reverse osmosis, however as the others become more economically feasible there use will increase. |
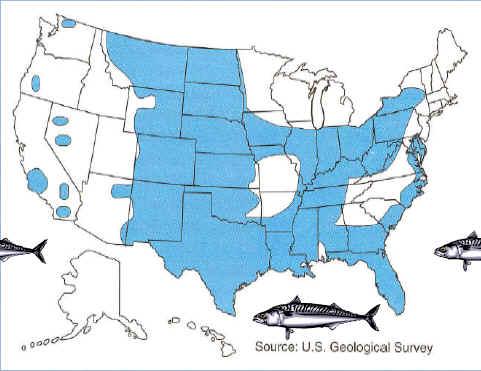
Figure 10. Saline Aquifers of The United States (Holz, 2003) |
|
Reverse Osmosis: Reverse Osmosis (RO) is one of the ways that water is cleaned in desalination plants. The RO process uses water permeable membranes to remove dissolved salts from the feedwater. The feed water is pressurized and pushed through the membrane. 250 - 400 pounds per square inch (psi) is required for brackish water and 800-1000 psi is required for seawater. The water that gets through the membrane is the product water, and the rest of the feedwater continues through the pressurized side of the reactor as brine. The incoming feedwater is pretreated to make it more compatible with the membrane. Suspended solids are removed, the pH is adjusted, and a threshold inhibitor. The feedwater is then pressurized to the proper psi depending on the waters salinity. The feedwater is then pushed through the permeable membrane. There are a variety of membranes that can be used for the RO process. The most popular are spiral wound and hollow fine fiber membranes made of cellulose acetate, aromatic polyamides, or thin polymer composites. Fresh water comes out of the membrane and the brine is discharged. The membrane used in RO is not perfect and some dissolved salts do pass through but at an acceptable level. The product water must now be stabilized. The product water is passed through a aeration column, where the pH is raised from approximately 5 to 7. The water is then piped to a storage tank for later use. A good RO system will remove 99 percent of the bacteria, and 90 percent of the organic solids (OAS 1, 2003). |
 Figure 11. Reverse Osmosis Membrane (Thomas and Cuccinello, 2004) |
| Distillation (Multi-stage flash systems): The multi-stage flash evaporator is another device used to desalinate water. The seawater or brine is heated until it is ready to flash, this flashed vapor is then drawn into the cooler tube where it is condensed and collected (Aquatech, 2004). Distillation is the oldest form of desalination with the first plant being put into operation in Curacao, Netherlands, in 1928(OAS 1, 2003). Filtered raw seawater is introduced into the system as cooling water for the condensation process, the majority of this cooling water is discharged, however a portion of this seawater is introduced into the system for distillation. This feedwater is deaerated and mixed with the recirculating brine water at the end of the process. This mixture of deaerated seawater and recycled brine (Fig. 12.) is pushed through the heating stages, this brine is heated more in each stage of the heat recovery process. After passing through the last of the heat recovery stages the brine is heated to it's hottest temperature of 110 degrees Fahrenheit in the brine heater, this brine is heated using an external stream of low pressure steam(OAS 1, 2003). Next the feedwater is passed through the stages where flashing occurs. Flashing is also called flash boiling. The flashing occurs when heated brine is turbulated in a chamber that has a lower vapor pressure than the heated brine. The brine gives up heat and a portion of it is given off as vapor, until the brine reaches the saturation temperature that correlates with the pressure in the chamber. Basically the heated brine is flashed due to pressure reduction. The pure vapor condenses in the condenser tubes and are piped to the distillate storage area. Brine droplets are removed from the vapor by entrainment separators. This entire process operates under a vacuum condition and moves from a low vacuum to high vacuum conditions from start to finish. The pressure differential between stages is the key to the multiple flashing (Aquatech, 2004). Figure 14 shows the largest current MSF desalination plant in operation, it is in Shuaiba, Saudi Arabia. It was completed on March 17, of 2003. The plant puts out 150 million m^3/year of water and cost $1.06 billion to build (Water Industry2, 2004). |
Figure 12. Multi-Stage Flash System (Aquatech, 2004) |
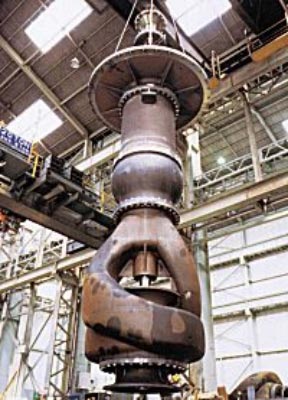
Figure 12. Mixed Flow Brine Recirculation Pump (Water Industry2, 2004) |
![]()
| Costs of Desalination: The cost of desalinated water is dropping rapidly. In 1990 the average cost of desalinated water was $6/K gallons, this fell to $2/K gallons, and is projected to fall to $1.50/k gallons in the year 2006(Chaudhry, 2003). This reduction in price per thousand gallons can also be seen in Figure 15, which shows the decrease in price in United States plants. Desalination costs are directly related to: Plant capacity, feed water quality, pretreatment, process/technology, and energy cost. The plant capacity plays in to the idea of economies of scale, the larger the plant and the greater the output, the cheaper the finished product is because there is a cheaper unit cost for the input. Large plants which are over 10 million gallons per day (MGD) operate at cost of $1.52-3.80/K gallons. Medium plants, 1-10 MGD produce desalinated water at $3.80 - $5.70/K gallons and small plants under 1 MGD operate over $5.70/K gallons. The feed water which is used in these plant is also directly related to the operation costs. For example when brackish feedwater is used the unit cost falls to $0.40 - $3.80/K gallons. Furthermore dirtier water may need more extensive pretreatments which drives up the costs. All of these plants run off of energy, whether it is to run the pumps, or create the heat to generate steam, this means they are subject to the current energy prices. If they can run more efficiently they can produce lower cost per unit (Chaudhry, 2003). |
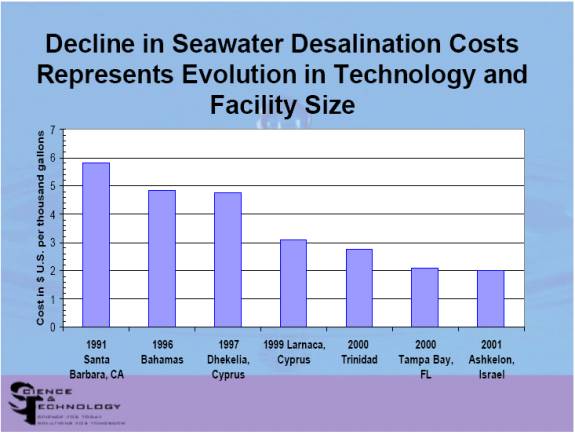
Figure 15, Decline in Seawater Desalination Graph (Holz, 2003) |
| Current Administration's Ideas: President George W. Bush's Fiscal Year 2005 budget calls for 21 million in Water 2025 funds. This proposal is a $13.4 million increase over Western Water Initiatives funds from Fiscal year 2004. Water 2025: Preventing Crisis and Conflict in the West was introduced in 2004 by Interior Secretary Gale Norton. The Water 2025 initiative invests in conservation projects, water saving technologies for irrigation, water management strategies, and research of desalination technologies, including research for more affordable technologies. This plan stresses mostly things that can be accomplished in a 24 month period. It is excellent that the problem associated with water are being looked at in the United States and that desalination research is included ((DOI, 2004) however $21 million is not sufficient funds whatsoever. To accomplish all that they which to accomplish substantially greater funds will be needed, furthermore long-term projects should be looked at as well. Water scarcity will soon be an enormous problem in the United States which will affect our people and our food supply, an all out effort should be put forth. Consider this the money we are spending for the security of potable water for American consumption and agriculture is 1/5650 of the money spent so far on the war in Iraq. Further more we are building desalination plants over there. |

References:
Aquatech, 2004. Multi-Stage Flash System. Retrieved March 15, 2004 from http://www.aquatech.com/aquachem/Process/multistageflash.htm.
Chaudhry, Shahid: California Energy Commission, 2003. Unit Cost of Desalination. Retrieved March 31, 2004 from http://www.owue.water.ca.gov/recycle/desal/Docs/UnitCostDesalination.pdf.
Department of the Interior (DOI), 2004. Water 2025. Retrieved April 16, 2004 from http://www.doi.gov/water2025/.
Environmental Protection Agency (EPA), 2003. All The Water In The World. Retrieved February 16, 2004 from http://www.epa.gov/region01/students/pdfs/ww_intro.pdf.
Holz, Del: Bureau of Reclamation, 2003. National Desalination Agenda. Retrieved March 31, 2004 from http://wrri.nmsu.edu/conf/forum/BOR.pdf.
Olympian: The Associated Press, 2003. Likely Sites of Water Wars Identified. Retrieved May 4, 2004 from http://www.theolympian.com/home/news/20030503/northwest/2887.shtml.
Organization of American States(OAS)1, 2003. Desalination By Reverse Osmosis. Retrieved February 16, 2004 from http://www.oas.org/usde/publications/Unit/oea59e/ch20.htm.
Organization of American States(OAS)2, 2003. Desalination By Distillation. Retrieved February 16, 2004 from http://www.oas.org/usde/publications/Unit/oea59e/ch21.htm.
Thomas, Bennet and Cuccinello, Michael, 2004. Saltwater Desalination. Retreived January 29, 2004 from http://www.cee.vt.edu/program_areas/environmental/teach/wtprimer/desalt/desalt.html.
U.S. Census Bureau, 2003. International Database: Total Midyear Population for the World 1950-2050. Retrieved February 10, 2004, from http://www.census.gov/ipc/www/worldpop.html.
U.S. Census Bureau, 2004. International Database. Retrieved February 9, 2004, from http://www.ac.wwu.edu/~stephan/Animation/pyramid.html.
Website For The Water Industry, 2004. Industry Projects: Ashkelon
Desalination Plant Israel.
Retrieved on January 29, 2004 from http://www.water-technology.net/projects/israel/index.html#israel4.
Website For The Water Industry2, 2004. Shuaiba Desalination Plant, Saudi Arabia. Retrieved March 20, 2004, from http://www.water-technology.net/projects/shuaiba/.
World Health Organization, 1995. Table 2.2: The Worlds Water. Retrieved February 16, 2004, from http://www.worldwater.org/table22.htm.
World Resources Institute (WRI), 2003. Earth Trends: Annual Renewable Water Supply Per Person by River Basin, 1995. Retrieved February 10, 2004, from http://earthtrends.wri.org/maps_spatial/index.cfm?theme=2.