Block the text you want to print, then click: file > print > selection > print.
27–30 August 2019 [week 1]
Introduction to the Course
Read appropriate sections of the textbook prior to class, take good notes, re-read the text and augment your notes, then see me if you are having difficulty. Do not fall behind or miss pieces of the puzzle.
Environmental Geology is the geology of the present. We will focus on landslides, flooding, and groundwater flow. Many of the laboratories will be held in the field at Deer Run Heights, Jeffersonville, VT. A textbook will not be required for this course, yet the writing associated with field and laboratory work is of utmost importance; continually review The
Elements of Style by William Strunk Jr.
(1918).
Fieldwork on Monday--please arrive to lab early and get the gear. Before we depart we will talk about grading, work, and planning.
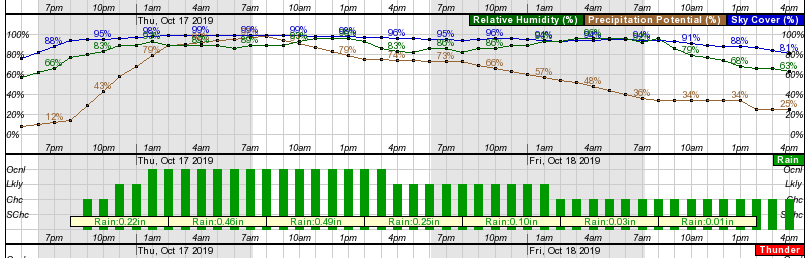
It may be wet outside, so dress appropriately. Check here for a weather forecast. The good thing about the rain is that we will get some weir data!
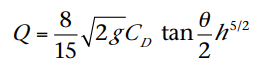
On Monday, at DRH, we will install four triangular thin-plate V-notch weirs with a downstream chamfers (designed and built by Ben). See Chapter 7 (page 185) in https://library.wmo.int/doc_num.php?explnum_id=219 and look at equation 7.1 (below). Who wants to make a spreadsheet that solves that equation using scroll bars to model CD and h ? It looks like the units are in meters, seconds, and degrees of arc. Do we need to calibrate the weirs and set CD (see page 198)?
Equation 7.1 for discharge using V-notch weirs.
I do want to get this work published and I would be so very happy to have one or all of you as co-authors on a paper. This will be really good work and it will be a really good learning experience. Instead of being told what to do, you have to figure out how to solve the problem, document the technique, and present it in a professional fashion.
We should consider the following topics (subheadings): research motivation, introduction to the problem, description of landslides and associated dangers and deaths, techniques employed at DRH, findings, and future work. Always, ask "how" and use subheadings that are descriptive.
30 September–4 October 2019 [Week 6]
Collected discharge data and v-notch height values from the weirs at DRH.
Graded Assignment (due 14 October 2019): Use the data collected from Weir 1 and Weir 2 [15 points]
Use Excel to make appropriate box and whisker plots to show the range of discharges measured at both wears.
Use Equation 7.1 (above) and the v-notch height values to calculate discharge.
Discuss the comparison between the measured (#1) and calculated (#2) discharges.
Submit a properly written report (title page, page numbers, appropriate subheadings, and proper references) that describes the situation.
7–11 October 2019 [Week 7]
Fall Break–be careful and stay safe.
14–18 September 2019 [Week 8]
Another successful field day (and a bit muddy). Bentonite was packed around weirs 3 and 4 (weirs 1, 2, and 4 seem to be working fine); the rain gauge was moved to the Brewster Uplands Trust field; three soil moisture probes were installed near the rain gauge.
We should get some good data this week--the rain is coming!
The goal of the field work this week is to accurately determine the elevations of the Weirs 1-4, and Monitoring Wells 1-4, using hand levelers and a total mapping station.
The weir discharge assignment (due last week on 14 Oct 2019) is considered to be a rough first draft of the goals of the activities associated with the weirs. As we know, nothing in life is simple, field work is not easy, writing is not easy, mathematics can be challenging, and communication is often tough. So, let us build on the first draft of the weir discharge assignment as it represents one component for assessing landslide danger at the Deer Run Heights region in Jeffersonville, VT.
Information required: weir locations, elevations, direct discharge measurements, and v-notch height measurements.
Final product: prose, graphs, location map, drawings, and appropriate citations.
Format: cover page (appropriate title and information), 1.5 line spacing, page numbers, references, clear figures, well-placed tables, great writing.
Sections in paper (though not necessarily these exact words):
Introduction to the field area and problem to be solved (purpose of the study, general problem, reason why weirs chosen, photographs).
Location of study area (maps, elevation, photographs). Weir data (installation, photographs, description of weirs, measured discharge, formatted spreadsheets, graphs, calculated v-height discharge, discrepancy discussion).
Interpretation of data.
Future work.
References.
All figures, graphs, tables, drawings and photographs should be referred to as figures. The first figure is Figure 1, the next is Figure 2, and so on. The type of figure (table, drawing, photograph, graph) will all be cited as a Figure.
Be sure to cite all sources and include all relevant information.
28 October–1 November 2019 [Week 10]
Fieldwork for Monday will focus on the stratigraphy at the landslide—wear solid shoes (preferably boots)—the slope is steep and slippery (and full of trees and mud and rocks and more).
4–8 November 2019 [Week 11]
Fieldwork for Monday: remove Weirs 3 and 4; collect HOBO logger data and TDR traces.
11–15 November 2019 [Week 12]
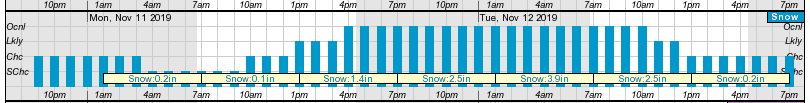
Fieldwork for Monday will be cold (about 25–29 °F). Please dress appropriately. This will be the last field day for the season and we need to get one more set of data from all loggers. The groundwater levels from the previous weeks' storm event remain high.
The data we have to work with includes the following: elevations, precipitation, stratigraphy, depth to water table (monitoring wells 1 and 2), barometric pressure, soil moisture (at 50, 100 and 150 cm), and stream gauge (two in Upper Stream and one in the Brewster).
Each of you suggested that the following figures could be informative:
compare precipitation to water table at MW1 and MW2
compare Upper Stream gauge to water table at MW1 and MW2
compare barometric pressure to stream gauge (Upper Stream and the Brewster)
compare precipitation to stream gauge (Upper Stream and the Brewster)
compare precipitation to water table at MW1 and MW2
compare soil moisture infiltration to water table at MW1 and MW2
Graded Assignment (due 2 December 2019): compare Upper Stream gauge to water table at MW1 and MW2 (number 2 above) [25 points]
Today we used Hoboware to plot approximately one year's worth of data from Upper Stream, Monitoring Well 1, and Monitoring Well 2.
Please complete the graph (number 2 above) and discuss it in a paper.
Include a cover page, clear figures, proper figure titles, proper references.
Share your observations, and distinguish them from your interpretations.
When we return from break we will use a permeameter to measure hydraulic conductivity in a variety of sediments. Please be familiar with the following terms: Darcy's Law, hydraulic conductivity, Reynold's number, and any other term on the handout which is new to you.
25–30 November 2019 [Week 14]
Thanksgiving Break—stay safe.
2–6 December 2019 [Week 15]
Lab: The refinery at Tesoro and Darcy’s Law.
Graded Assignment (due 9 December 2019): Darcy's Law [25 points]
Use the handout to guide the laboratory work; record all data on the tracking sheet.
Graded Assignment (due 19 December 2019): Deer Run Heights paper [50 points]
Describe the landslide problem at Deer Run Heights in Jeffersonville, VT.
Start with a clear thesis. Have a subheading called 'Thesis'. Write a few sentences. Take a position. Support that position with the writing and the data.
Be sure to have a title page (with an informative title), subheadings, thesis statement, introduction to the area and the problems, field techniques and findings, observations, and future work.
Use clear subheadings, clear figures, proper figure titles, proper references.
Look for similarities and differences in the patterns of rainfall, streamflow (both streams), water table height (all wells), and infiltration rates (soil moisture probes).
Use the data that shows the relationship between MW1, MW2, UpperStream, UpperStreamDS, precipitation, infiltration, stratigraphy, and the water table.
Create at least four, unique, informative, and clear figures using the data collected this semester that can be found here (OneDrive) and here (Google Doc).
Be sure the legends are clear, fonts are large enough, and the colors are distinct – if this will be printed on black and white paper, then use line patterns because colors will not be distinguishable.
Capitalise proper nouns: Figure 1, Figure 2, Monitoring Well 1, and so on.
Create a few acronyms, for example, "Monitoring Well (MW) 2 mimics the flow in Upper Stream..." So, when referring to this well in the future, all one needs to say is MW 2 or MW1 or MW 3.
Always refer to a figure by its figure number (such as Figure 1 or Figure 2) – never write "the graph above (or below or wherever).
Note: The HOBO loggers measure changes in pressure that reflect changes in the depth of the water table. When talking about this, be sure to discuss the function of the barometric compensator.
9–13 December 2019 [Week 16]
Graded Assignment (due in lab on 9 December 2019): Stream flooding and recurrence intervals [15 points]